New scale to rank season’s algae
NOAA predicts 5 or 6 on scale of 1 to 10 for Lake Erie this summer
7/11/2014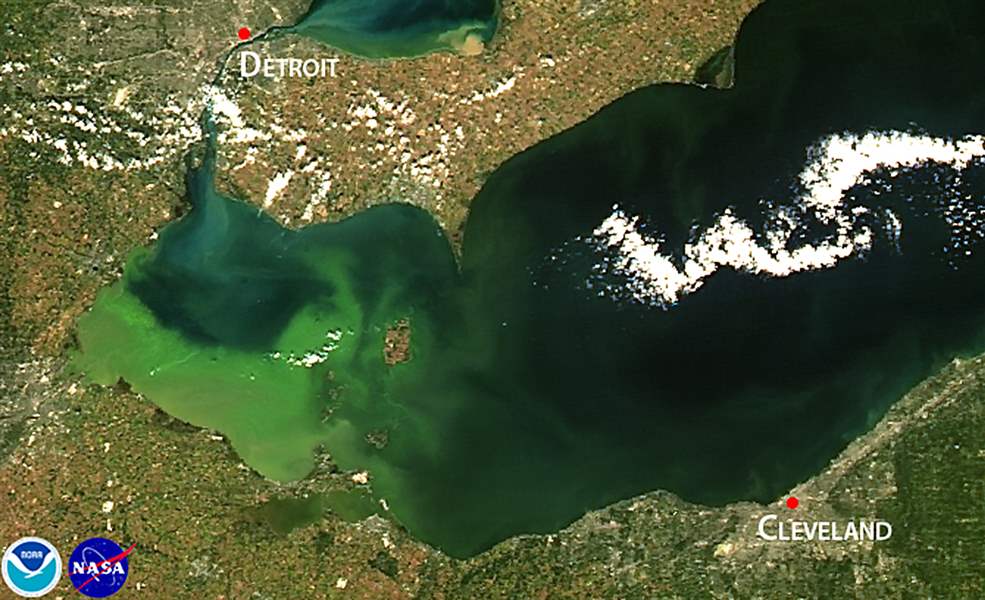
Satellite image of the 2013 algae bloom on Lake Erie.

Satellite image of the 2013 algae bloom on Lake Erie.
GIBRALTAR ISLAND, Ohio — Much like earthquakes, annual expectations for western Lake Erie algae are now being expressed in degrees of magnitude.
In a first for the National Oceanic and Atmospheric Administration, the agency Thursday unveiled a gradient scale to help people better understand how bad this summer’s algae outbreak is likely to be.
On a scale of 1 to 10, the record algal bloom of 2011 ranks a 10.
Last summer’s heavy bloom — bad, but not as rough as 2011 — ranked an 8.
This summer’s algae is expected to be a 5 or 6 on that scale, according to Rick Stumpf, a NOAA oceanographer who is the lead researcher for the new forecasting system that began in 2012.
The forecast is produced by Mr. Stumpf and other scientists at NOAA’s National Centers for Coastal Ocean Science in Silver Spring, Md.
It includes 12 years of Lake Erie nutrient-flow data generated by Heidelberg University's National Center for Water Quality Research, as well as satellite data from the European Space Agency’s ENVISAT and NASA’s Terra and Aqua satellites.
During his presentation Thursday at Ohio State University’s Stone Laboratory on Gibraltar Island, near Put-in-Bay, Mr. Stumpf said the federal agency will continue to use adjectives such as mild, severe, or significant to describe its annual expectations.

Justin Chaffin, the Ohio State University Stone Laboratory research coordinator, holds a device used to collect water samples directly from Lake Erie to check for algae and tiny organisms. He was aboard Ohio State’s research vessel Thursday.
But it also realized an algae chart, sort of like the Richter scale used for earthquakes, could help people better comprehend the algae forecasts, Mr. Stumpf said.
From an adjective-descriptor standpoint, western Lake Erie likely will have another “significant” bloom of toxic algae this summer, Mr. Stumpf said.
It is expected to bunch up in certain areas instead of being spread out as evenly as in past years, he said.
Once again, the dominant species is expected to be microcystis, which has a toxin — microcystin — capable of killing humans.
No deaths have been reported in the Great Lakes area from microcystin exposure, but there have been numerous sicknesses and reports of dead animals over the years. In 1995, the U.S. Centers for Disease Control and Prevention investigated a microcystin outbreak that killed 75 people in Brazil who were being treated at a kidney dialysis center.
Microcystis has appeared almost annually in western Lake Erie since 1995, reversing a 20-year trend of low algae. Many forms of algae are good for fish and the aquatic food chain.
Phosphorus is the fertilizer that is the primary food for algae. The more phosphorus that flows off land and spills into rivers and streams from sewage overflows determines the size of the algal bloom.
One new bit of information at this year’s briefing was the role of another common farm and lawn fertilizer, nitrogen.
Scientists are now learning levels of nitrogen affect the toxicity and type of algae that becomes most dominant, Justin Chaffin, OSU Stone Laboratory research coordinator, said.
“Having extra nitrogen will exacerbate a bloom,” Mr. Chaffin said.
Last year’s bloom appears to have been underestimated because of heavy July rain, Mr. Stumpf said.

Rick Stumpf, NOAA oceanographer and lead researcher of its algae forecast, looks at a Lake Erie water sample near Put-in-Bay.
While scientists believe the runoff and sewage spills between March 1 and June 30 have the greatest impact, the July rain threw them for a loop when making the 2013 forecast.
“Clearly, [last year’s forecast] was very severely underestimated. [The 2013 algae bloom] was much worse than we expected,” Mr. Stumpf said.
Another factor was warmer water.
Western Lake Erie’s average temperature in June, 2013, was 70 degrees, six degrees warmer than when the lake had a similar amount of phosphorus loaded into it in June, 2003, Tom Bridgeman, an algae researcher at the University of Toledo’s Lake Erie Center, said.
Although the July rain was the driving factor behind last year’s heavy algae, the lake was primed for a large bloom because of how warm it had gotten by June, scientists said.
Data is not yet available to calculate this June’s average temperature for western Lake Erie. But the lake is believed to be about as warm as it was last summer, Mr. Bridgeman said.
“If we have an exceptionally wet July, we may revise the forecast,” Mr. Stumpf said. “But it won’t be lower than it is now.”
Any revision would occur around the first week of August, he said.
Algae blooms usually peak in mid to late-September.
The upward trend of algae growth in recent years appears to be related, in part, to “seed stock” left over from previous outbreaks and warmer water, Mr. Bridgeman said.
“Whether it’s seed stock or climate change, the system seems to be producing more algae now with the same [phosphorus] load, for whatever reason,” Mr. Bridgeman said.
Last winter’s heavy Great Lakes ice appears unlikely to suppress this summer’s algae because of Lake Erie’s shallowness and how fast it has warmed up, he said.
Laura Johnson, research scientist at Heidelberg University’s National Center for Water Quality Research, said total phosphorus runoff into the Maumee River was 3.32 cubic kilometers between March 1 and June 30, well above the mean of 2.66 cubic kilometers but less than the 2011 total of 5.02 cubic kilometers. Dissolved phosphorus was calculated at 293 metric tons this spring, down from 429 metric tons in 2011.
One good sign, though: Nitrogen releases have been on the decline, a sign that farmers are applying that nutrient more efficiently and getting more of it absorbed by the plants for which it is intended, such as corn, she said.
The Heidelberg lab has been monitoring the Maumee River watershed since 1975.
The Ohio Phosphorus Task Force has called for phosphorus reductions of more than 40 percent, a goal that will require more changes in farming practices.
Because of climate change, it “may take several years” of nutrient reductions to turn Lake Erie around, Mr. Bridgeman said. “The lake now seems to be in an injured state,” he said. “Lake Erie is slow to respond biologically.”
Contact Tom Henry at: thenry@theblade.com or 419-724-6079.